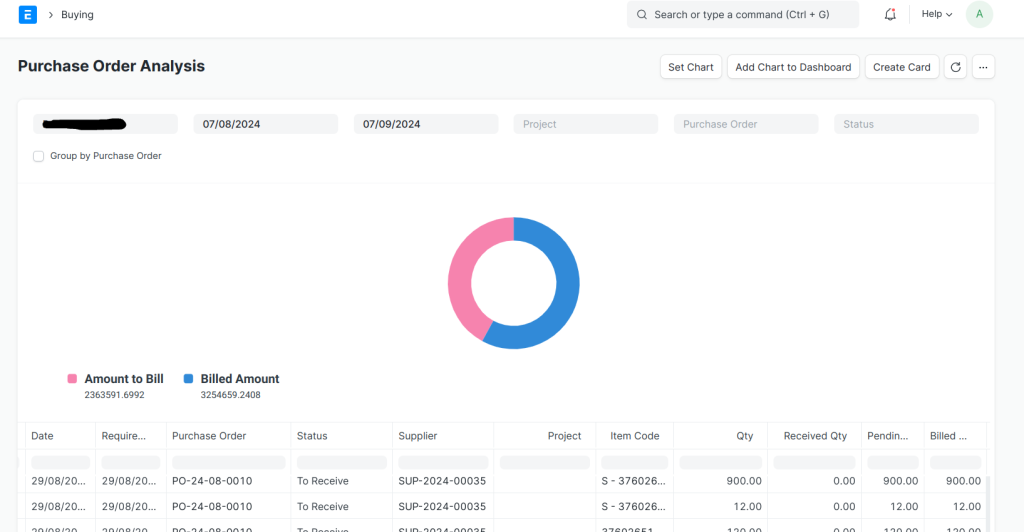
Purchase order analysis plays a crucial role in managing the flow of products or services in Supply Chain. When the volume of purchase orders is high, it becomes quite challenging in tracking the status of each PO, deliveries against the POs, delay in deliveries and supplier performance.
Purchase Order Analysis Report in ERPNext provides valuable insights into the purchasing patterns, tracking deliveries and supplier performance. It helps organizations make data-driven decisions, optimize procurement process, and enhance overall operational efficiency.
If you want track which purchase order are yet to be received or already received but yet to be billed or completed, then this is an ideal report for tracking.

Benefits of Purchase Order Analysis Report
Purchase Patterns: It helps in analyzing the buying patterns, frequently purchased items and items purchased project wise.
Supplier Evaluation: Helps in evaluating suppliers’ reliability by assessing the timelines of delivery and pricing.
Tracking of Deliveries: Tracking of the items yet to be received or purchase orders yet to be billed in real-time.

How to use this Report
By Date Range: Filter the purchase orders by a date range. The purchase orders will be filtered based on the start date and end date selected in the standard filters.
By Project: By filtering the project in the standard filters, you can track the purchase orders raised against the selected project.
By Status: The purchase orders can be filtered based on the status such as To Receive and Bill, To Receive, To Bill, Completed.
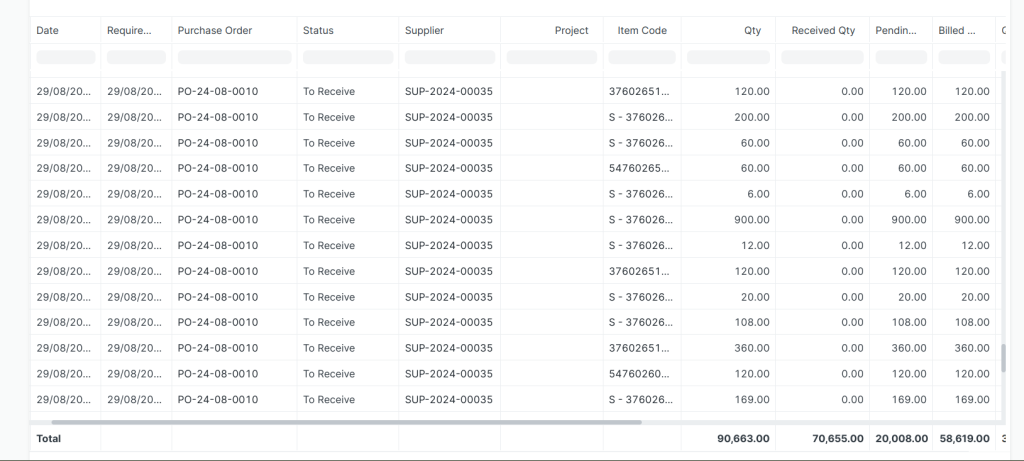
Grouping by PO: By default, all the purchase orders are displayed item-wise. However, if you select “Group by Purchase Order” then the summarized figure against each PO will be displayed.
Item wise Tracking: You can filter the item column by typing the item name or code. This way you can track the orders placed for same item across different suppliers or monitor the fluctuations in rates or track the status of deliveries and billing.
Supplier wise Tracking: Enter the name or code of the supplier in the respective column to filter the report by supplier. This will help in evaluating the delays in delivery for the items ordered.
Dashboard Charts or Cards: Customer cards and charts can be created based on the data in report. These can be added in standard or customer dashboard or in the workspace.
